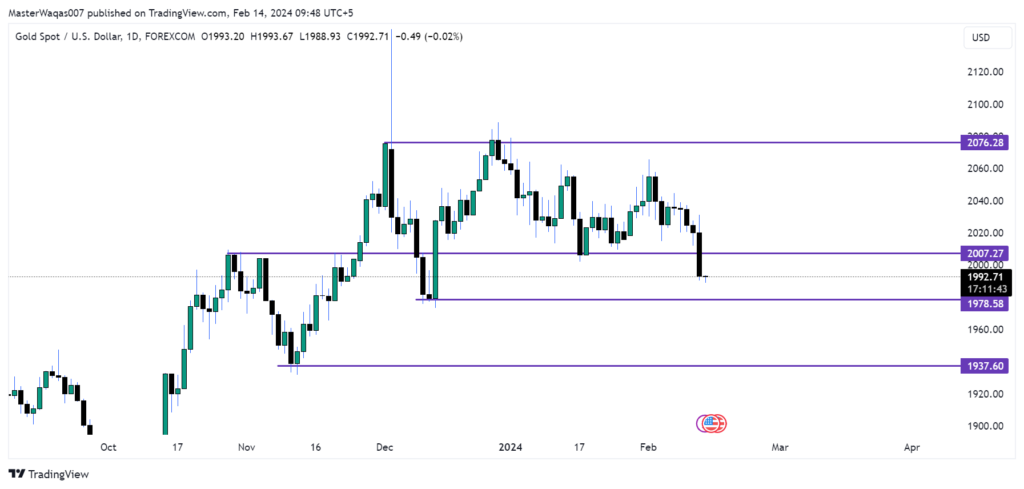
Gold current price at 10’o Clock on 14/Fab/2024 = $1992.5
| Strong Resistance Zones | Strong Support Zones |
| 1st Gold Resistance Area = 1997 – 2000 2nd Gold Resistance Area = 2004 – 2007 3rd Gold Resistance Area = 2009 – 2012 | 1st Gold Support Area = 1992 – 1990 2nd Gold Support Area = 1980 – 1978 3rd Gold Support Area = 1976 – 1973 |

Market Dynamics:
Gold XAUUSD recently tested resistance at $2023/$2026 and remained below $2029, prompting a short position. The metal experienced a significant downturn following the release of the Consumer Price Index (CPI), breaking support at $2013/$2011. Subsequently, Gold hit the next targets at $2003/$2000 and $1990, with the latter coinciding with the 100-day moving average, suggesting a potential bounce. However, this rebound is not guaranteed, and engaging in long positions is considered risky. A cautious approach would be to consider using any recovery as an opportunity for shorts at $2007/$2010, setting stops above $2015. The targets for these shorts are $1998 and $1991.
Sell Signal:
A break below $1987 serves as today’s sell signal, with the stop positioned above $1993. The potential targets for this sell-off are $1981/$1980 and $1974/$1972. Further losses could extend eventually as far as $1967/$1965.
Whether you’re a seasoned trader navigating the intricate world of Gold trading or a newcomer testing the waters, these detailed insights aim to provide a nuanced perspective on the current market trends. Wishing you fruitful and informed trading sessions on this day, February 14, 2024!
If you’re eager to discuss these updated analyses with fellow enthusiasts and traders, consider joining our VIP Signal group
link: https://chat.whatsapp.com/KkvnJZ3kF5dFSFiMC4gxlV
For more information, Contact us at:
Our website: Fxtprofit.com
What’sapp: +923107507060
Email: [email protected]


