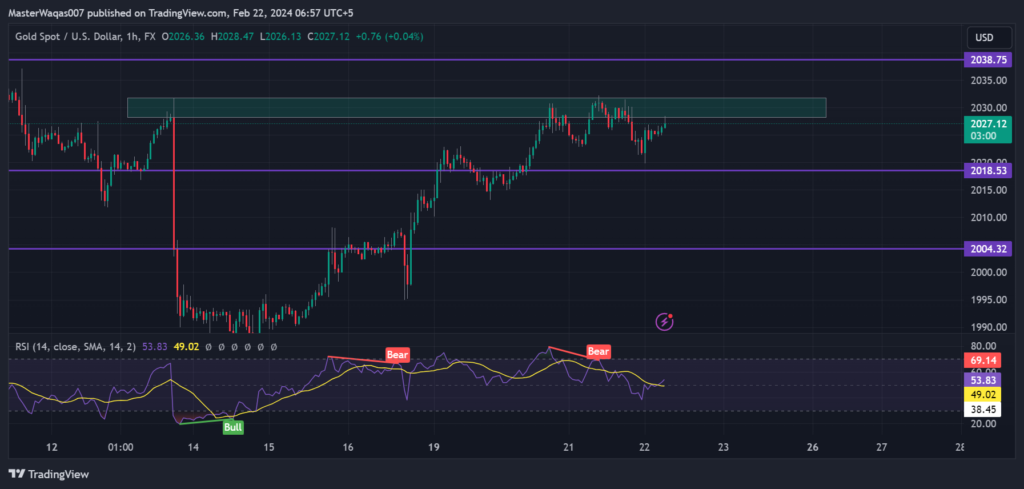
Gold trading current price at 8’o Clock on 22/02/2024 = $2027

| Strong Resistance Zones | Strong Support Zones |
| 1st Gold Resistance Area = 2032 – 2036 2nd Gold Resistance Area = 2045 – 2049 3rd Gold Resistance Area = 2060 – 2064 | 1st Gold Support Area = 2023 – 2018 2nd Gold Support Area = 2004 – 1999 3rd Gold Support Area = 1992 – 1988 |
Market Overview for Gold Trading:
In the moment of Gold trading, XAUUSD recently dipped to $2,018 after reaching the robust level of $2,032. As we thread through Wednesday’s Asian trading, gold prices showcase a remarkable resilience near $2,030, extending an impressive five-day rally. The persisting weakness of the US Dollar remains a pivotal force, propelling gold to higher realms.
Important News for Gold Trading:
Recent news of China reducing into Flash Manufacturing PMI Interest rates has provided additional support to gold, accompanied by a decline in US Treasury bond yields. The gold market seems to benefit from US fiscal concerns, creating a backdrop that puts pressure on the US Dollar. Traders were eagerly awaiting insights from the Federal Reserve Minutes but FOMC did not move the market significantly in any direction thus, again in the same consideration range of 2014-2038.
Today at 22 fab 20204, Flash Manufacturing PMI and Flash Services PMI are main news to look for significant moves in GOLD prices.
Technical Overview for Gold Trading:
A significant development occurred on Tuesday, as the gold price successfully closed above the 21-day Simple Moving Average (SMA), positioned at $2,023.
The 14-day Relative Strength Index (RSI) paints an optimistic picture, extending its recovery beyond the midline. This suggests a potential shift in favor of gold buyers.
Future Projections with trade opportunities for Gold Trading:
Looking ahead, the immediate resistance is now identified at the $2,033 level at which the Gold has bounced back 3-times to 2022 adn 2018 level, where the 50-day SMA and the high from February 13 correspond. A sustained breakthrough at this level could open up fresh buying opportunities, targeting the high from February 7 at $2,044 and the psychological barrier of $2,050.
On the flip side, if gold sellers regain control, the 21-day SMA at $2,023 becomes a critical support level. A failure to defend this could initiate a new downward movement towards the previous day’s low of $2,015, followed by the rising trendline support at $2,011.
It’s worth noting that the upward-pointing 100-day SMA at $2,002 is likely to pose a significant challenge for gold sellers, serving as a robust support level in the current market conditions.
Whether you’re a seasoned trader navigating the intricate world of Gold trading or a newcomer testing the waters, these detailed insights aim to provide a nuanced perspective on the current market trends. Wishing you fruitful and informed trading sessions on this day, Happy Trading!
If you’re eager to discuss these updated analyses with fellow enthusiasts and traders, consider joining our VIP Signal group
link: https://chat.whatsapp.com/KkvnJZ3kF5dFSFiMC4gxlV
For more information, Contact us at:
Our website: Fxtprofit.com
What’sapp: +923107507060
Email: [email protected]


